

.png)
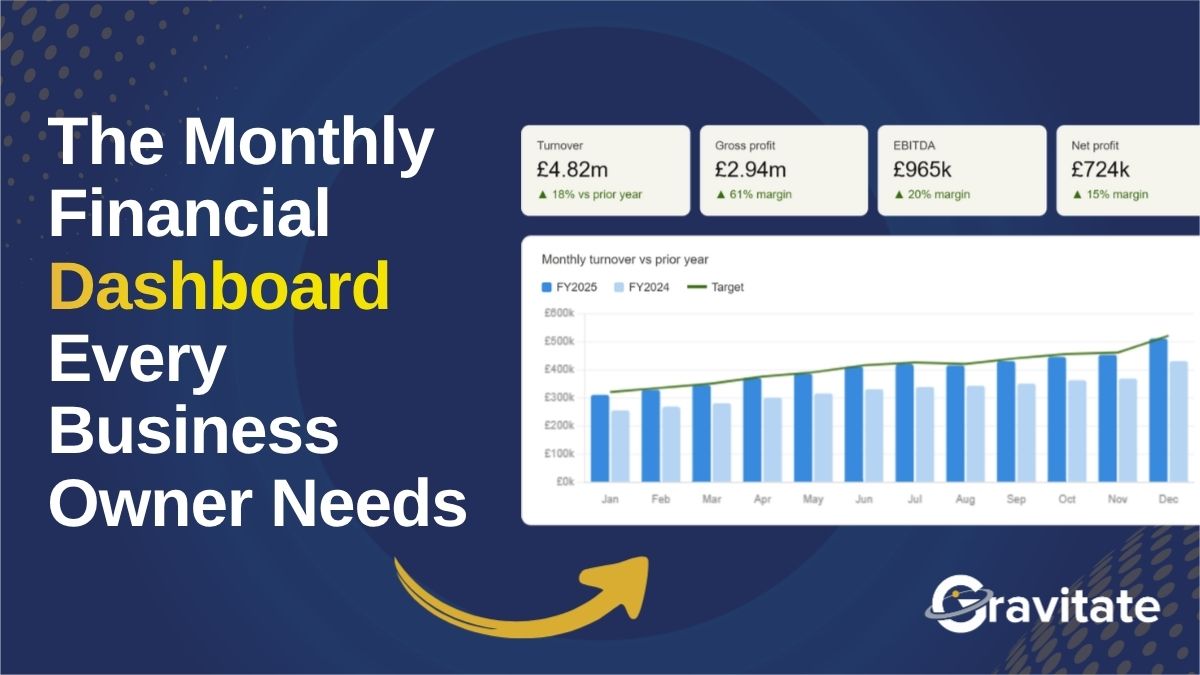
Too often, business owners receive financial reports that they don’t actually use. Typical financial reports can be too detailed and hard to interpret.
A financial dashboard, however, can take under 10 minutes to review, highlight trends and problems early, and answer questions like, “are we profitable?”. They are a simpler and more beneficial way to get a clear idea of your business and its future.
What is a Financial Dashboard?
A financial dashboard is a visual tool that presents critical financial data and key metrics in a way that can be read and understood at a glance.
They help you compare options, scenarios, and possible results as well as track the progress and outcomes of your actions.
.webp)
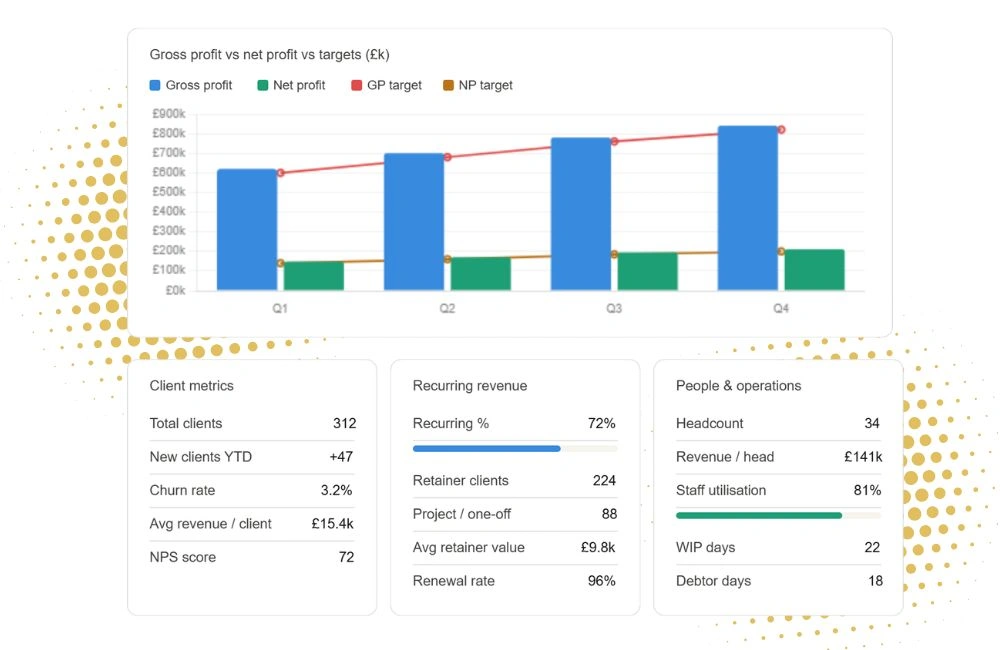
What Does a Financial Dashboard Include?
If you put good information into your accounting software, lots of data can be extracted from it. A useful dashboard that includes charts, tables, maps, gauges, sliders, and other interactive features will make this data easy to understand and explore.
It is important to make sure that you identify the data relevant to your business specifically. Metrics like revenue, budget, gross margin, and net profit will not be the same for everyone. Every business is different and the key indicators for you could be vastly different to another organisation.
The good thing is that you can customise the dashboard to suit your goals, preferences, and situation.
The Difference Between Reporting and Insight
Dashboards prioritise real-time insights. Instead of raw numbers, they focus on trends, benchmarks and what the numbers are telling you to do.
Since they continuously update with the latest information, users can identify immediate trends and adjust them as and when.
Common Financial Dashboard Mistakes
Some common mistakes when designing a dashboard include:
- Overcrowding: Filling your dashboard with too many metrics can get overwhelming and confusing.
- Misleading or overcomplicated visualisations: The key is to keep your dashboard simple, so that it can be understood at a glance.
- No narrative: Ensure there is context to your data so that it is understandable and relevant.
- No comparatives: Comparing your data to prior months, years, and budgets paints a clearer picture of how your business is performing.
Being mindful of these mistakes will prevent your dashboard from being too long, unclear, and difficult to read.
What makes a good dashboard?
A good monthly dashboard should help you answer three questions:
- “Are we making money?”
- "Are we running out of cash?"
- "Is the business getting healthier or weaker?"
Knowing the answer to these questions is key to understanding and anticipating the future of your business.
When you know your numbers, you gain control. A financial dashboard gives you the financial clarity and control to helps make better future decisions. For more information, get in touch!

.jpg)

%2010.jpg)


.webp)

.svg)
